
1. Access the module
Click here to learn how to access the Occurrences module in Qualiex.
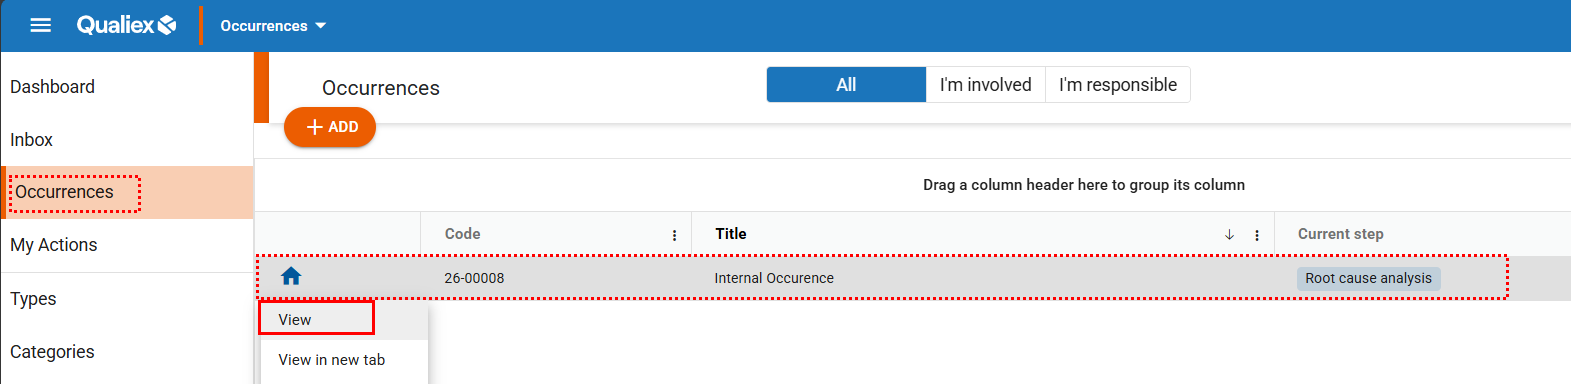
2. Locating the occurrence
To perform the cause analysis of an occurrence, you must be either the person responsible for the occurrence or the person responsible for the cause‑analysis stage.
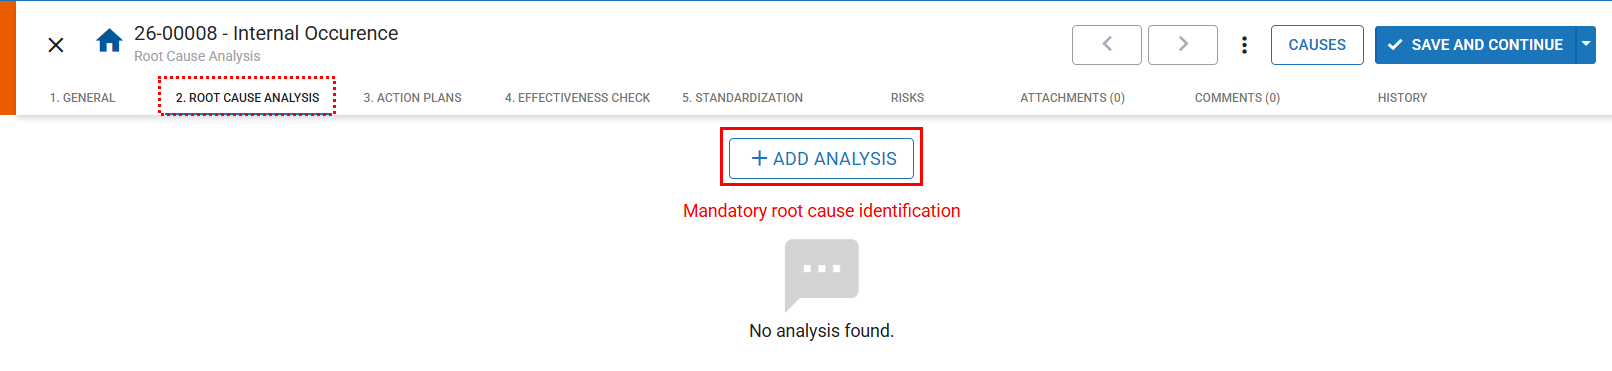
3. Adding the cause‑analysis tool
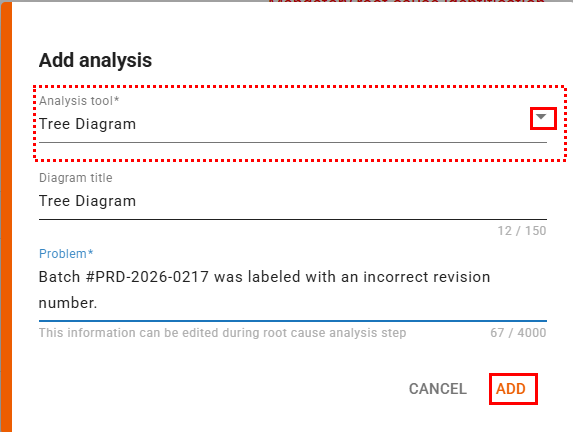
A screen will open for you to select which analysis tool will be used:
-
Analysis Tool (required): you can choose between Ishikawa Diagram, Tree Diagram, or 5 Whys.
To select the tool, click
 , then choose the option “Tree Diagram.”
 -
Title (optional): you may define a title for the tool.
-
Problem (required): this field will automatically be filled with the occurrence title, and you may complement or completely modify it.
Click “Add” to include the tool.
The available and mandatory tools depend on the module’s configuration. Click here to learn more.
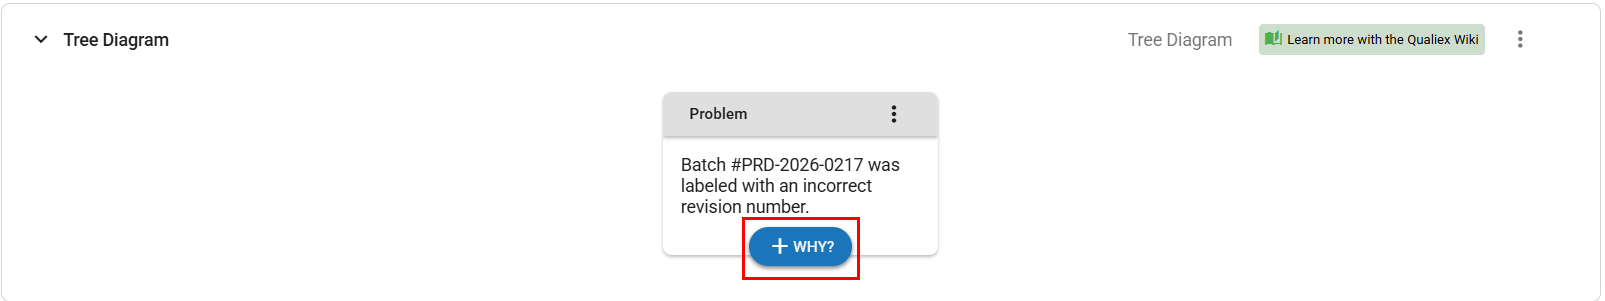
4. Filling in the Tree Diagram
With the tool added, click ![]() to insert the “whys.”
to insert the “whys.”
A screen will appear for entering a single “why.”
The following fields will be displayed:
- View of the previous answer: this helps guide the evaluation for the next “why.”
- Why?: enter the new “why.”
- Root cause: if, in this step, the identified “why” is determined to be the root cause, you can enable this option.
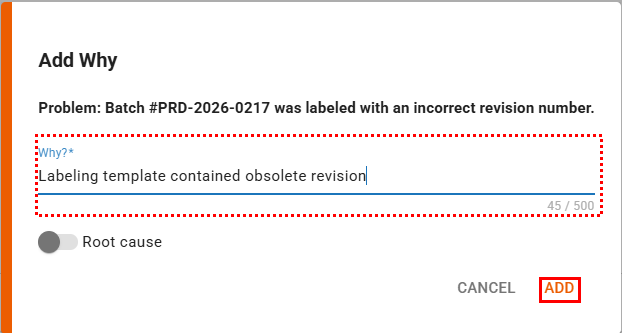
After completing the information, click “Add.”
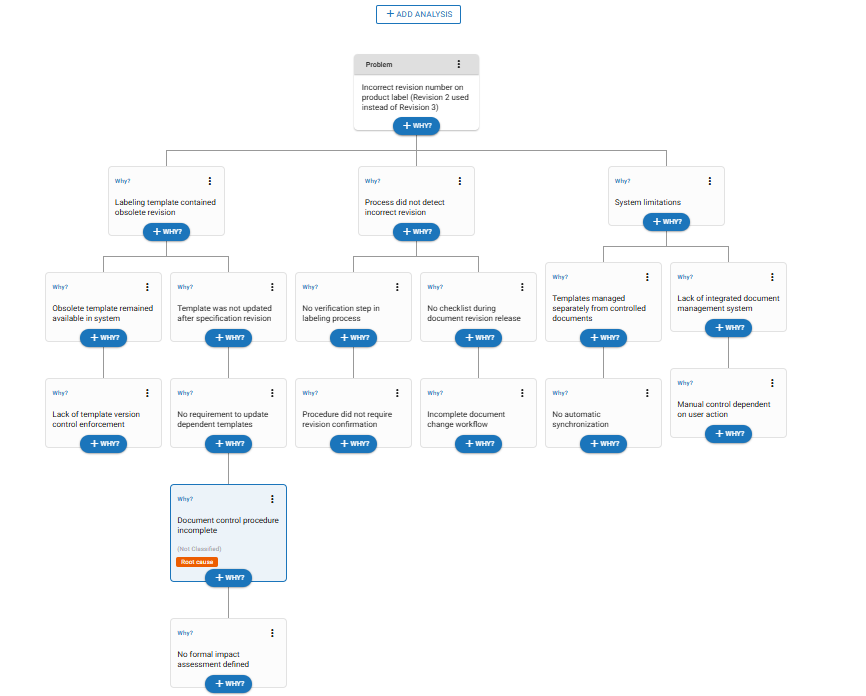
Once all the “whys” have been added, the Tree Diagram is complete.
More tool options
You can edit the diagram, the problem, and the “whys” that have been added.
-
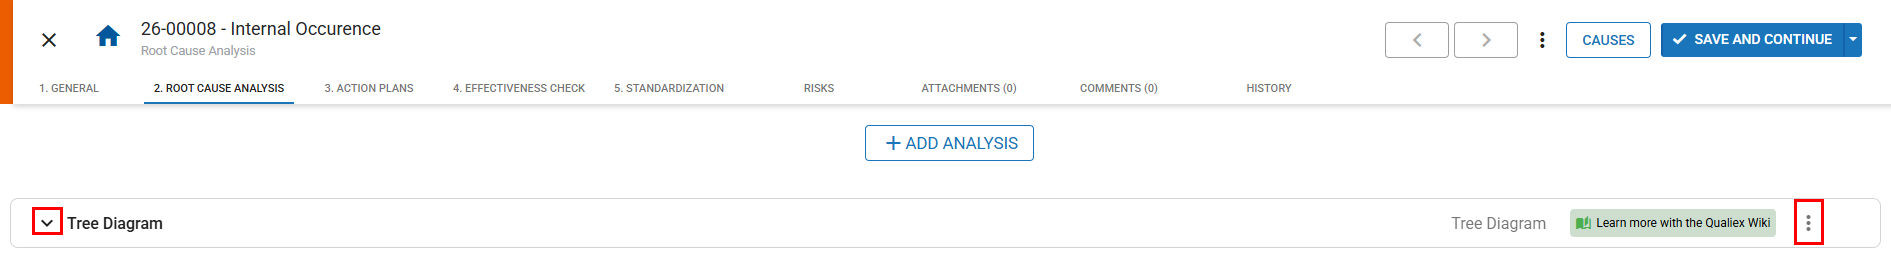
Click
 to collapse or expand the tool view.
 -
In the tool’s context menu
 , the following options are available:
-
Edit: Change the name of the tool.
-
Remove: Delete the diagram.
-
-
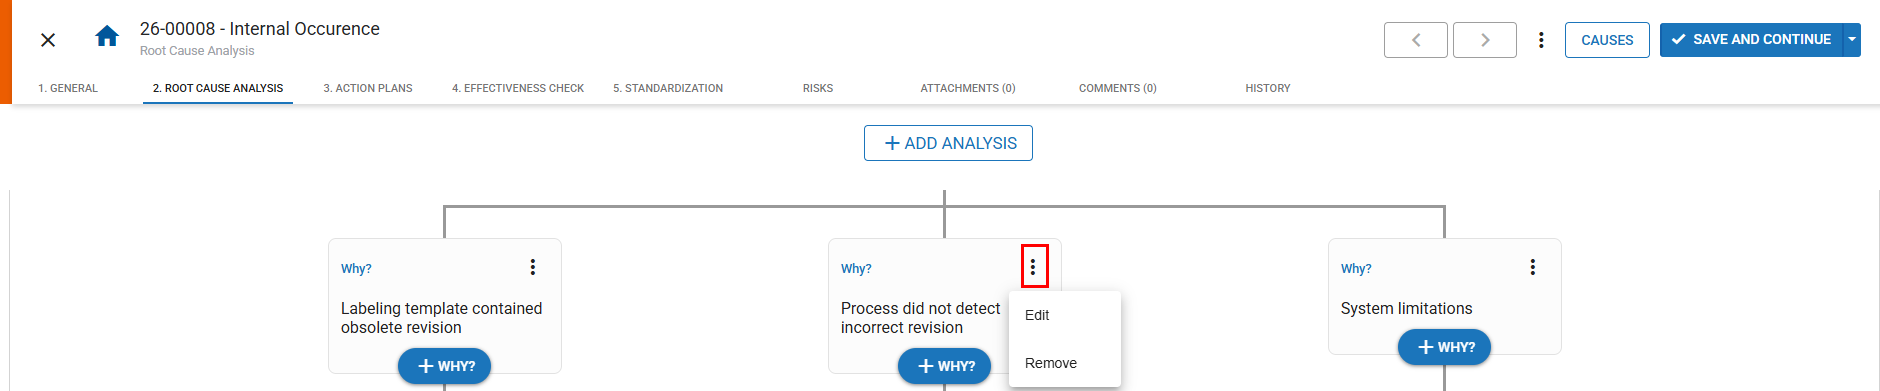
In the context menu
 of a “why,” the following options are available:
-
Edit: Modify the information entered for that “why.”
-
Remove: Delete the corresponding “why.”
-